Weather Maps
 A bit inspired by a tweet from Noel Jenkins and by some Year 3/4 work I saw at my son's primary school, I dug out some old drag and drop html techniques and came up with an interactive weather map.
You can use the standard 70s/80s BBC weather symbols to produce your own weather map. The symbols will move around however you want them to and you should have plenty of symbols to play with.
I think there are probably a wide range of potential uses - from primary up to lower secondary certainly:
- developing familiarity with weather symbols and types of weather
- students presenting their own weather forecast
- predicting future weather
- if you have a board you can write on then you could add your own frontal systems
- having maps open in more than one window would allow you to show the passage of weather across the UK
- creating weather maps and saving them using screenshots for use in class
There are some technical notes at the foot of the page you might want to read.
The Weather Maps
There are three choices of map. Which one you opt for will depend more on your screen resolution than anything. It's worth noting that these probably won't work on iPads or similar devicesß.
Standard Maps - basic weather symbols only
> Wider area map - including most of Denmark and the Atlantic approaches
> Tight UK map - more suitable for narrower screen resolutions perhaps
> Mexican Map - especially for Mrs Allen's class, a map of Mexico with weather symbols!
> Brazil Map - this is decent sized map and should fit fine
> Ibiza Map - made on request...
> Spain map - quite wide. For Mr Banfield's classes
> Alternative Spain map - with a different map
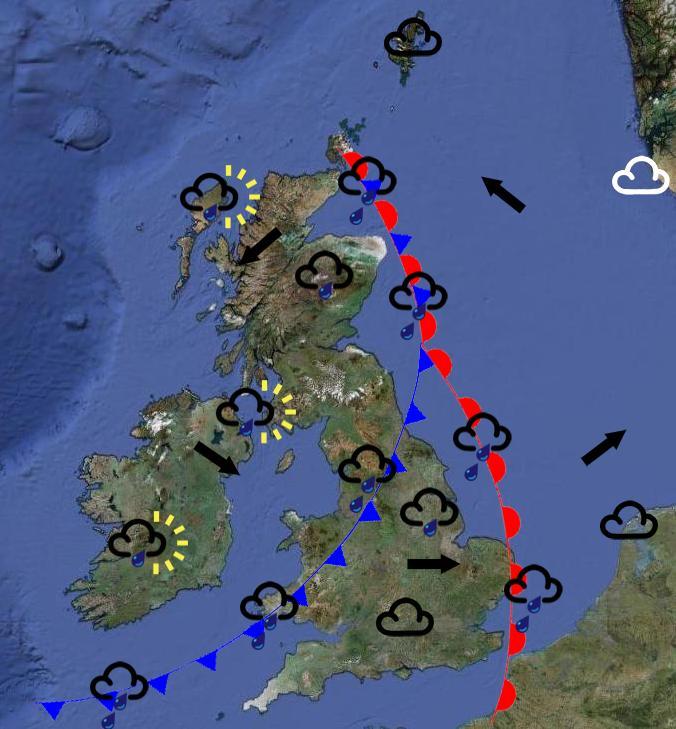
Maps with Fronts - these have three cold and two warm fronts and an occlusion as well. And now wind arrows!
> European map - let me know if the fronts are a bit too long in this
The fronts might be a little tricky to drag around - the images are actually square boxes and you may find that once you have the fronts in place that it gets a little trickier to move other symbols.
Historical Note
To fully appreciate the nature of these maps you might want to view some old UK weather forecasts. You Tube has a few you might want to try:
> 31st January 1979 forecast![]() (NB: you'll probably get ads with this one)
(NB: you'll probably get ads with this one)
> 15th December 1982 forecast![]() - actually the whole closedown of BBC1 on that evening, which is astonishing to watch
- actually the whole closedown of BBC1 on that evening, which is astonishing to watch
I was going to suggest that students might need to see these to appreciate how the weather used to be presented, but then I guess there's a whole lot of teachers who won't remember it being done this way either...
Technical Notes
The maps require JavaScript to run. This shouldn't be a major problem and they've been tested on most major browsers.
You may find that you need to scroll vertically - on a narrow monitor the symbols may well get pushed below the map. You might want to go to Full Screen mode (F11 usually does this - then use F11 or Esc to get out of it).
You have 16 of each symbol available (apart from the smiley sun - there's only four of those). If that becomes a problem or if you have any technical difficulties with these resources, please let me know as and I'll see what I can do.
The legal bit
Feel free to use these for non-profit use in any way you want. A link back here would be nice.
The weather symbol images originally came from Mel's Brushes![]() and are used under the terms they were downloaded under - for non-profit use. I've modified them (and added some) and reduced them dramatically in size in order to reduce loading times.
and are used under the terms they were downloaded under - for non-profit use. I've modified them (and added some) and reduced them dramatically in size in order to reduce loading times.
The JavaScript comes from Walter Zorn's library![]() , and is used under the terms they were downloaded under too. My JavaScript certainly isn't good enough to fiddle with the js file!
, and is used under the terms they were downloaded under too. My JavaScript certainly isn't good enough to fiddle with the js file!